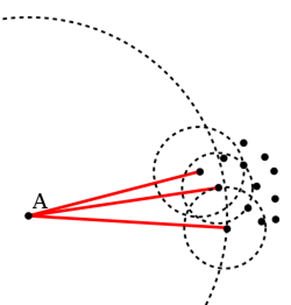
local outlier fator(이하 lof)는 각 점들의 밀도와 이웃점들의 밀도를 고려하여 해당 점의 스코어를 계산합니다.

lof를 구하기 앞서 먼저 reachability-distance를 구해야 한다.
reachability-distance(A,B)는 두 점 사이의 거리와 B에서 k번째 근접이웃까지의 거리중
큰 값이 reachability-distance의 값이 된다. 예를 들어,

위 그림에서 빨간선으로 이어진 점들을 B라고 볼때,
A까지의 거리가 각 점들에서 k-distance보다 크므로 빨간선이 reachability-distance값이 된다.

그 다음으로 lrd(local reachability density)를 구해야 한다.
여기서 Nk는 k-distance내 점들의 집합이다.
A가 밀도가 높지 않은 지역에 위치할 경우 A로부터 집합내의 점 B까지 거리가 길어지므로,
A의 lrd값은 작아진다.

최종적으로 lof는 주변 이웃 점들의 평균 lrd값을 구하고,
A의 lrd값을 나누어줌으로써 구해진다.
위에서 언급했듯,
A가 밀도가 높지 않은 지역에 위치할 경우 lrd값은 작아지므로 반대로 lof값은 커진다. (분모이므로)
import numpy as np
import matplotlib.pyplot as plt
from sklearn.neighbors import LocalOutlierFactor

print(__doc__)

np.random.seed(42)

# Generate train data
X_inliers = 0.3 * np.random.randn(100, 2)
X_inliers = np.r_[X_inliers + 2, X_inliers - 2]

# Generate some outliers
X_outliers = np.random.uniform(low=-4, high=4, size=(20, 2))
X = np.r_[X_inliers, X_outliers]

n_outliers = len(X_outliers)
ground_truth = np.ones(len(X), dtype=int)
ground_truth[-n_outliers:] = -1

# fit the model for outlier detection (default)
clf = LocalOutlierFactor(n_neighbors=20, contamination=0.1)
# use fit_predict to compute the predicted labels of the training samples
# (when LOF is used for outlier detection, the estimator has no predict,
# decision_function and score_samples methods).
y_pred = clf.fit_predict(X)
X_scores = clf.negative_outlier_factor_

plt.title("Local Outlier Factor (LOF)")
plt.scatter(X[:, 0], X[:, 1], color='k', s=3., label='Data points')
# plot circles with radius proportional to the outlier scores
radius = (X_scores.max() - X_scores) / (X_scores.max() - X_scores.min())
plt.scatter(X[:, 0], X[:, 1], s=1000 * radius, edgecolors='r',
            facecolors='none', label='Outlier scores')
plt.axis('tight')
plt.xlim((-5, 5))
plt.ylim((-5, 5))
n=np.copy(X_scores*-1) # 스코어값이 음수로 나오므로
n[n<2]=np.nan          # 스코어값이 2보다 작으면 표시 안함
n=np.round(n,2)
for i, txt in enumerate(n):
    if np.isnan(txt):continue
    plt.annotate(txt, (X[i,0], X[i,1]))
legend = plt.legend(loc='upper left')  # 범례 위치
plt.show()
-----------------------------------------------------------------------------------------------------------------------------------
참고
https://scikit-learn.org/stable/auto_examples/neighbors/plot_lof_outlier_detection.html
Outlier detection with Local Outlier Factor (LOF) — scikit-learn 0.21.3 documentation
Note Click here to download the full example code Outlier detection with Local Outlier Factor (LOF) The Local Outlier Factor (LOF) algorithm is an unsupervised anomaly detection method which computes the local density deviation of a given data point with r
scikit-learn.org
https://jayhey.github.io/novelty%20detection/2017/11/10/Novelty_detection_LOF/
로컬 아웃라이어 팩터(Local Outlier Factors)
오브젝트 근처에 있는 데이터들의 밀도까지 고려하는 로컬 아웃라이어 팩터(Local outlier factor)입니다. 근처 데이터의 밀도까지 고려하는 모델로서 다른 방법론들이 해당 데이터만 고려한다면 이 방법은 근처 데이터까지의 거리와 밀도까지 상대적으로 고려해줍니다.
jayhey.github.io
https://godongyoung.github.io/머신러닝/2019/03/11/Local-Outlier-Factor(LOF).html
'프로그래밍 > Python' 카테고리의 다른 글
| flask-admin에서 ModelView 페이지 접근 막는 법 (0) | 2023.05.01 |
|---|---|
| flask-admin 에서 pk, fk 등이 보이지 않고, 수정, 추가 안될때 해결 방법 (0) | 2023.05.01 |
| ball tree (0) | 2019.08.01 |
| kd tree (1) | 2019.07.04 |
| keras를 활용한 다중선형회귀분석 (2) | 2019.05.30 |